


Über dieses Audioangebot & Ihr Feedback
Die Audioversion dieses Artikels wurde künstlich erzeugt. Wir entwickeln dieses Angebot stetig weiter und freuen uns über Ihr Feedback.
Efficient communication and collaboration is a prerequisite for successful agile project management. But how it is possible to develop agile teams and to measure the individual performance? Therefore exists a refined tool: the Agile Partnership Chart. Dr. Arthur Kolb and Pritam Sen present the methodology, show the process and describe the experience in a case study.
Efficient communication and collaboration is a prerequisite for successful agile project management. But how it is possible to develop agile teams and to measure the individual performance? Therefore exists a refined tool: the Agile Partnership Chart. Dr. Arthur Kolb and Pritam Sen present the methodology, show the process and describe the experience in a case study.
Agile software development has changed the way software development used to work in the past. Agile approach prefers shorter iterations for software development processes unlike the traditional development approach. Agile processes also emphasize that the software development iterations should be shorter, incremental and people centric (Schwaber, 2011).
Efficient communication and collaboration is a prerequisite for successful agile project management. But there are no processes proposed to develop teams and to measure the individual performance. The main objective of this article is the introduction of a tool to develop and monitor high performance teams in agile projects. We will present the methodology, show the process and describe the experience in a case study. The applicability of the tool is shown in a use case at a big internet company in Germany.
The "Agile Partnership Chart" was derived from the project management tool "Stakeholder Management" (Freeman, 2010). Generally, stakeholders are anyone with a legitimate interest in the project. This may include investors/board, management, end-users, developers and anyone who is funding, building or using the product.
To be successful it is important to have close people collaboration with the Scrum team members who represent different domain expertise like software development, product management, project management, usability, build and release engineers. This close collaboration can be monitored with the help of the "Agile Partnership Chart".
The "Agile Partnership Chart" is versatile and can be used by anyone who wants to monitor people collaboration. This tool can be used to promote a whole team approach in a Scrum team to show the team members how synergetic and collaborative they were towards the achievement of the team goals.
A Scrum team requires a collection of people with specialized skills. Therefore when people with specialized skills work together a certain level of commitment and a certain attitude will exist. In a Scrum team, commitment and attitude can co-exist and the "Agile Partnership Chart" allows for positioning a team member according to their levels.
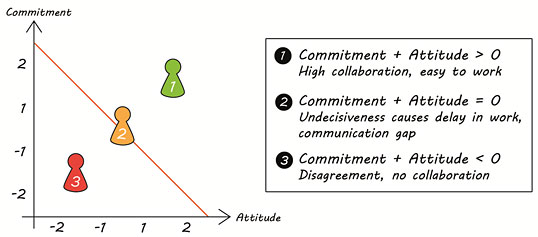
Figure 1: Commitment and Attitude co-exist.
The quality of collaboration can be mapped with the "Agile Partnership Chart". When the sum of commitment and attitude of a team member is greater than 0 then it is easy to work together and create high synergy and collaboration. When the sum is equal 0 then the team member is undecided and causes delay of work items. And finally when the sum is a negative number, it is easy to disagree with each other and there is no or only little collaboration (see figure 1).
The 4 quadrants of the "Agile Partnership Chart" can also be presented diagrammatically as shown below (see figure 2). The red line that runs through the intersection is where the sum of commitment and attitude is zero. The "Agile Partnership Chart" acknowledges the fact that commitment and attitude can co-exist within an individual. And this individual level of commitment and attitude will have an effect on the overall team dynamics in any project.
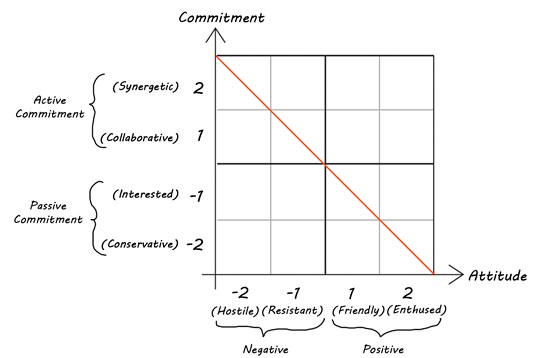
Figure 2: Pictorial Representation of 4 Quadrants in Agile Partnership Chart.
pro Monat, bei jährlicher Zahlung im ersten Jahr, danach 24,99 € pro Monat. Code SOMMERPROJEKT im Checkout eingeben.
Simon Berg
14.02.2015
Frank Lehmke
14.02.2015